A decade ago we made a simple promise to Tower Hamlets primary care: your performance data, online, anytime, with no login. This is the story of everything that changed to keep it — from an embedded Excel sheet in 2015 to the purpose-built PCND platform of today.
2015–26
A decade in service
16
Reporting domains
5
Platform generations
0
Logins required
The journey · 2015 → today
2015 / 16Excel Online
The first line was a spreadsheet
Every story has a first line. Ours was a spreadsheet.
In 2015/16, primary care in Tower Hamlets was awash with dashboards nobody opened. NIS performance data arrived as a stream of oversized spreadsheets — heavy on email, light on insight — and the changes that actually mattered were nearly impossible to see across NIS areas.
So we tried something deliberately simple. Instead of sending the spreadsheet, we published it: embedded live on a web page, open to every constituent practice, at any hour, with no login in the way. It was a small idea with an outsized effect — visits climbed almost immediately, and the principle it proved has anchored everything since. The original workbook is embedded below, exactly as it first appeared.
tower-hamlets-online · 2015/16 workbookLive
The workbook that began it all — published, not emailed.
Resources used · 2015/16
Software
Excel Online (web embed)
Data source
Network EMIS
Business rules
EMIS searches by CEG
Transformation
Manual
Access
Open, no login
2016 / 17ClicData
From document to product
A static sheet answered “what is the data?”. The next one had to answer “what does it mean?”
In 2016/17 we rebuilt the dashboard as something interactive — charts, graphs and visual summaries that let a practice read its position at a glance rather than decode a grid of numbers. This first interactive version had no dedicated address yet, and stayed within Network 2 while we learned what worked. It was the moment the dashboard stopped being a document and started becoming a product.
The first interactive iteration — Network 2 only, 2016/17.
Resources used · 2016/17
Software
ClicData & Network EMIS
Data source
Network EMIS
Business rules
EMIS searches by CEG
Transformation
Manual & Excel tools
Access
Network 2 only
2017 / 18ClicData
Widening the lens
With the format proven, we widened the lens.
Through 2017/18 the dashboard grew beyond core NIS metrics to take in e-Consult, population trends and patient access — a fuller picture of how practices were really working. We refined the visuals on every page, and as our command of data transformation matured, refresh times fell. The dashboard was becoming something colleagues relied on, not just something they consulted.
Broader reporting and refreshed visuals, 2017/18.
Resources used · 2017/18
Software
ClicData & Network EMIS
Data source
Network EMIS
Business rules
EMIS searches by CEG
Transformation
Manual & Excel tools
Access
Network 2 only
2018 / 19ClicData
Hello, Tower Hamlets
Good tools travel. Ours started to.
By 2018/19, what began as a Network 2 project was drawing interest from across the borough. Rather than keep it in-house, we opened it to every Network in Tower Hamlets — a single shared resource serving practices, Networks and CCG reporting alike. We relaunched it under the newly formed GP Care Group with a complete visual refresh, and the response brought fresh appetite for reporting well beyond NIS. Wider reach meant heavier lifting, but we carried it forward as a genuinely borough-wide asset.
Borough-wide relaunch under GP Care Group, 2018/19.
Resources used · 2018/19
Software
ClicData & Network EMIS
Data source
Network EMIS
Business rules
EMIS searches by CEG
Transformation
Manual & Excel tools
Access
Borough-wide
2019 / 20Python + ClicData
Automation under the hood
Growth exposed the seams. The answer was automation.
The 2019/20 release added more reporting areas and gave colleagues practical tools for their quarterly CCG returns — but the real change was invisible to most users. We replaced a heavily manual transformation process with a purpose-built Python pipeline, cutting refresh time dramatically and, just as importantly, freeing us to build rather than maintain. The pipeline was sharpened continually alongside the BIU team. Pulling data still meant extracting from eight separate Network EMIS accounts by hand — a bottleneck we were determined to solve next.
Python enters the pipeline — 2019/20.
Resources used · 2019/20
Software
ClicData & Network EMIS
Data source
Network EMIS
Business rules
EMIS searches by CEG
Transformation
Python pipeline
Access
Borough-wide
2020 / 21Python + ClicData
Sharpening the craft
With the pipeline in place, we spent a year getting better at the details.
2020/21 was refinement rather than reinvention. Python processing and ClicData remained the backbone, while the dashboards themselves gained richer features and more considered visuals. Each iteration made the same data easier to read, act on and trust — the quiet, compounding work that turns a useful tool into an indispensable one.
Resources used · 2020/21
Software
ClicData & Network EMIS
Data source
Network EMIS
Business rules
EMIS searches by CEG
Transformation
Python pipeline
Access
Borough-wide
2021 / 22Power BI
The leap we never looked back from
Then came the change that redefined what a dashboard could be.
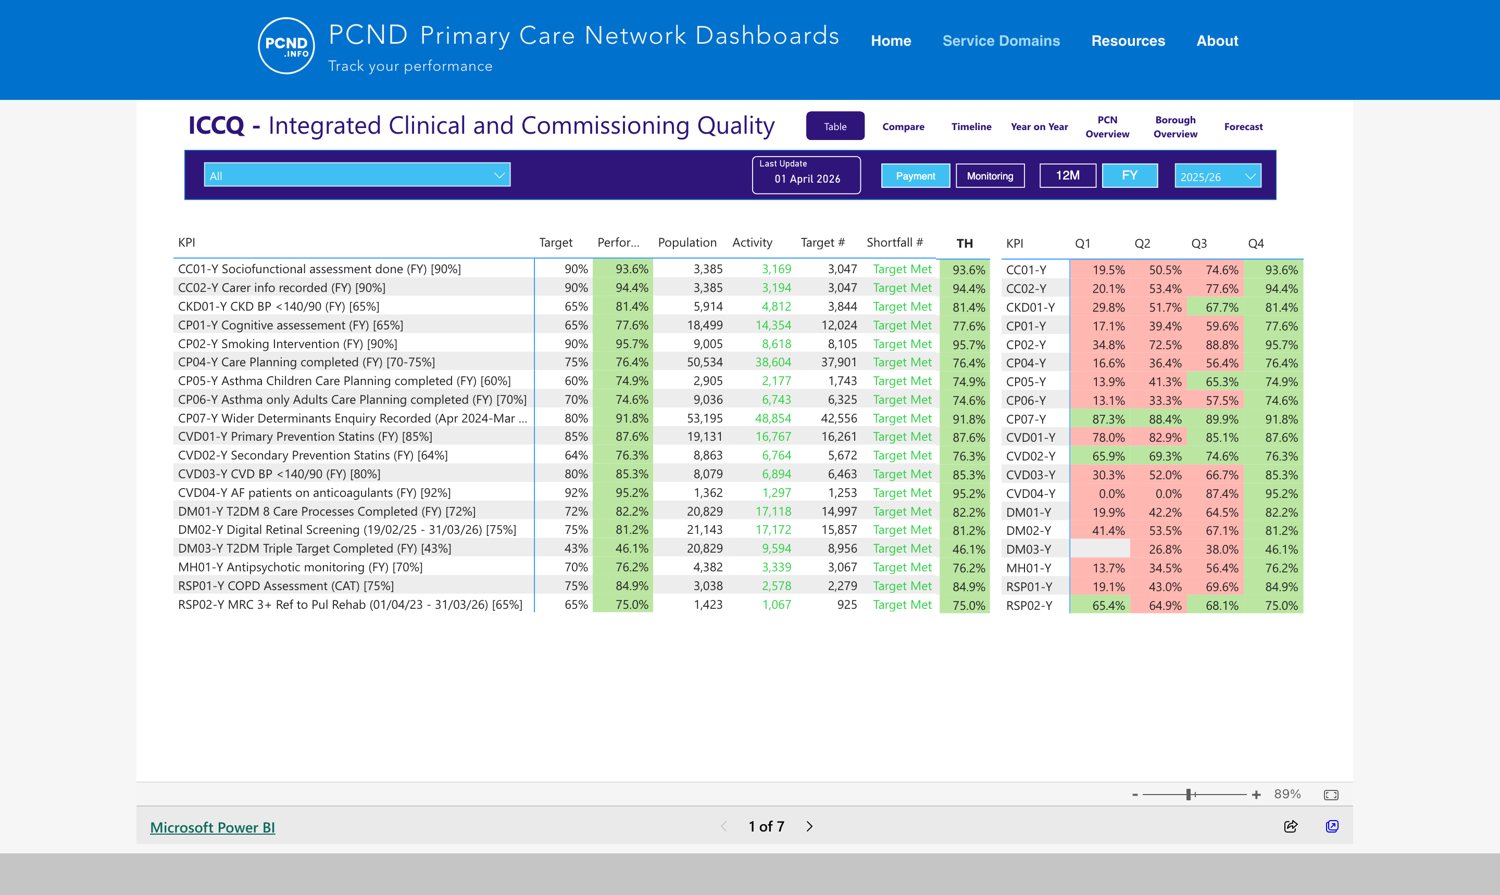
In 2021/22 we brought Power BI into the platform for the first time — and never looked back. Paired with a custom, dedicated website built around Power BI embeds, we could finally move past the performance figures into the context around them: support-team information, contract specifications, EMIS data-flow guidance and more, delivered through structured templates and searches. The dashboard became a knowledge platform — somewhere to understand the system, not just measure it.
The Power BI era — the ICCQ contract dashboard on the gpcg.info platform.
Resources used · 2021/22
Software
Power BI & custom website
Data source
Network EMIS
Business rules
EMIS searches by CEG
Transformation
Python & Power BI
Access
Borough-wide
2022 / 23Power BI
From practitioners to teachers
Momentum turned into expertise — and expertise started to travel.
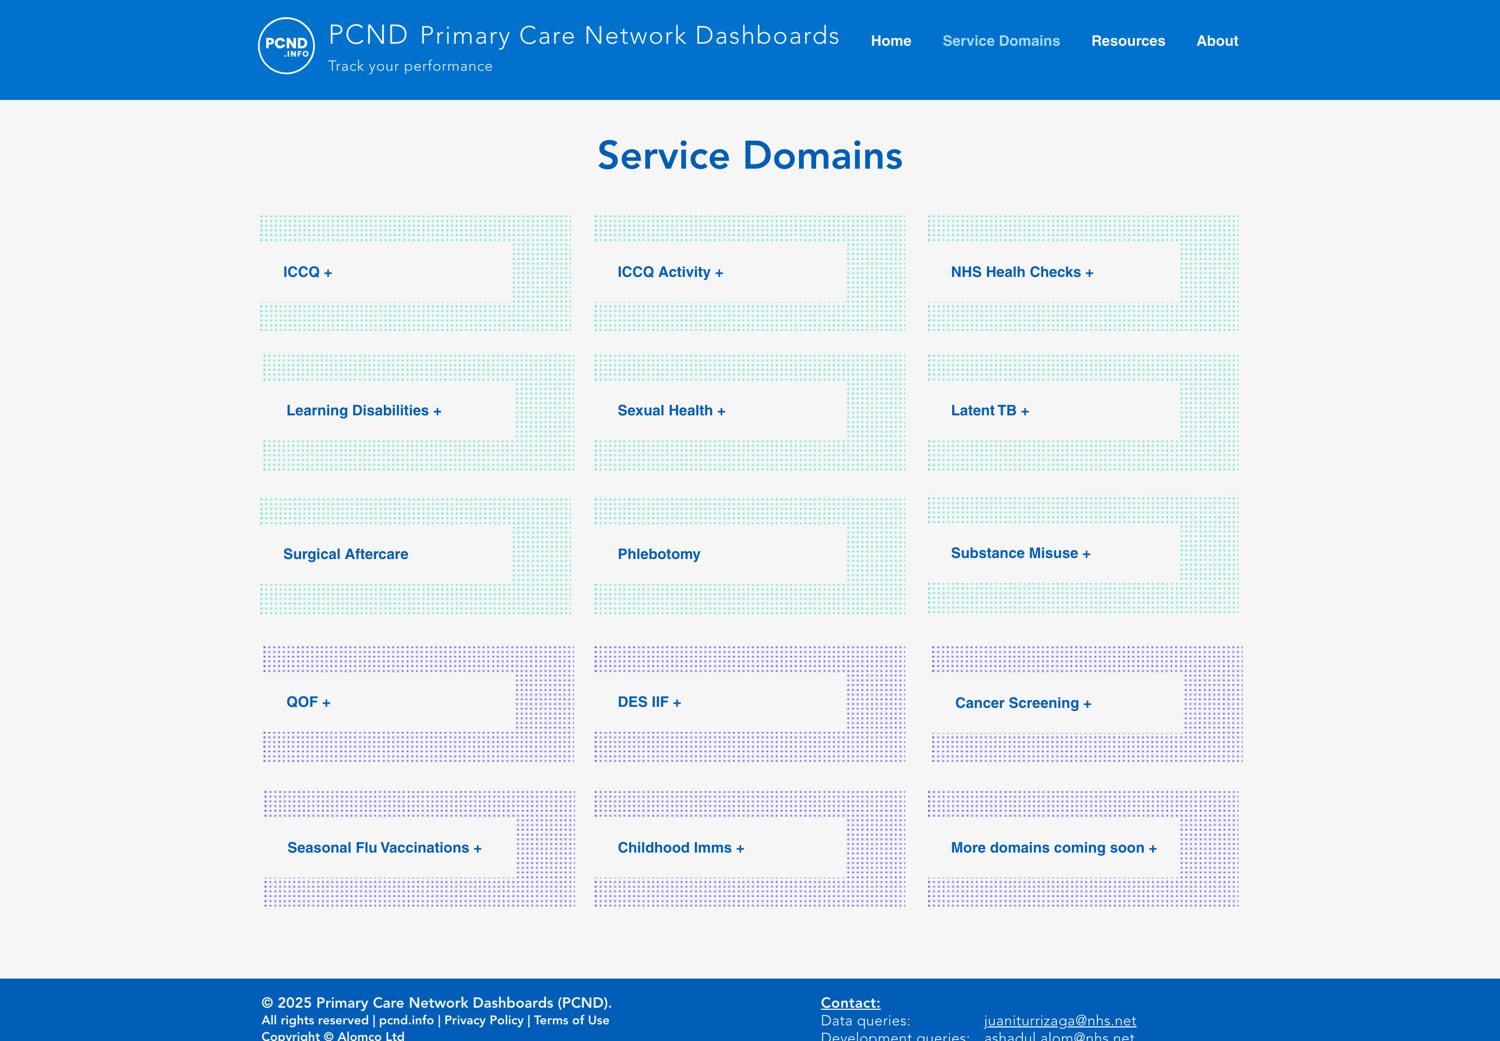
As our Power BI capability deepened through 2022/23, the platform's reputation reached beyond Tower Hamlets. The PCND team published dashboards for CEG at QMUL, and went on to deliver Power BI training to their data analysts — a measure of how far the practice had come, from embedding a spreadsheet to teaching the craft to others.
A whole library of contract domains, published on the Power BI platform.
Resources used · 2022/23
Software
Power BI & custom website
Data source
Network EMIS
Business rules
EMIS searches by CEG
Transformation
Python & Power BI
Reach
Tower Hamlets & CEG, QMUL
2023 / 24Power BI
Maturity, and its edges
Maturity is its own kind of progress — and its own kind of signal.
2023/24 was a year of consolidation and steady growth: more reporting, wider adoption, and a platform doing its job well across the borough. But maturity brings clarity. The more we asked of an embed-based model, the more we could feel its edges — and the ambition was beginning to outgrow the tools carrying it.
Resources used · 2023/24
Software
Power BI & custom website
Data source
Network EMIS
Business rules
EMIS searches by CEG
Transformation
Python & Power BI
Access
Borough-wide
2024 / 25Power BI
Meeting the ceiling
Every platform eventually meets its ceiling. We had found ours.
By 2024/25 the Power BI platform was mature, trusted and widely used — and we understood its limits precisely because we'd pushed it so far. Delivering the experience we now wanted — faster, more integrated, more tailored to how PCNs actually work — meant stepping beyond embeds and templates. The case for building something of our own had become impossible to ignore.
Resources used · 2024/25
Software
Power BI & custom website
Data source
Network EMIS
Business rules
EMIS searches by CEG
Transformation
Python & Power BI
Access
Borough-wide
Live now
2026 / 27Bespoke platform
So we built it
A decade of lessons, engineered into one platform.
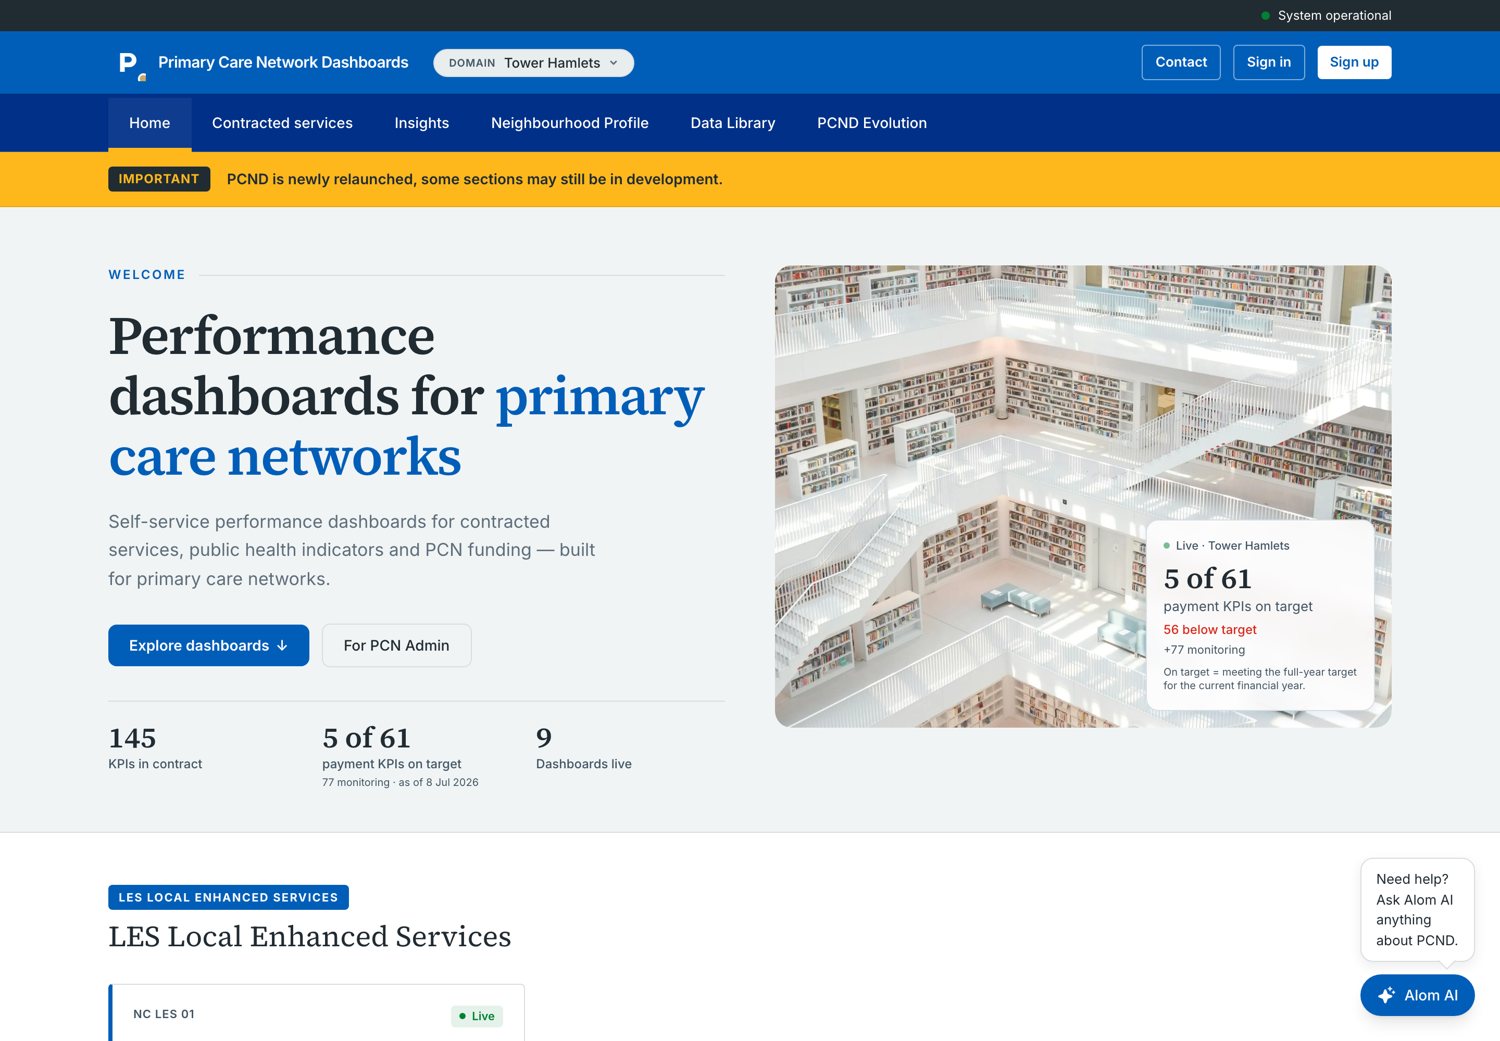
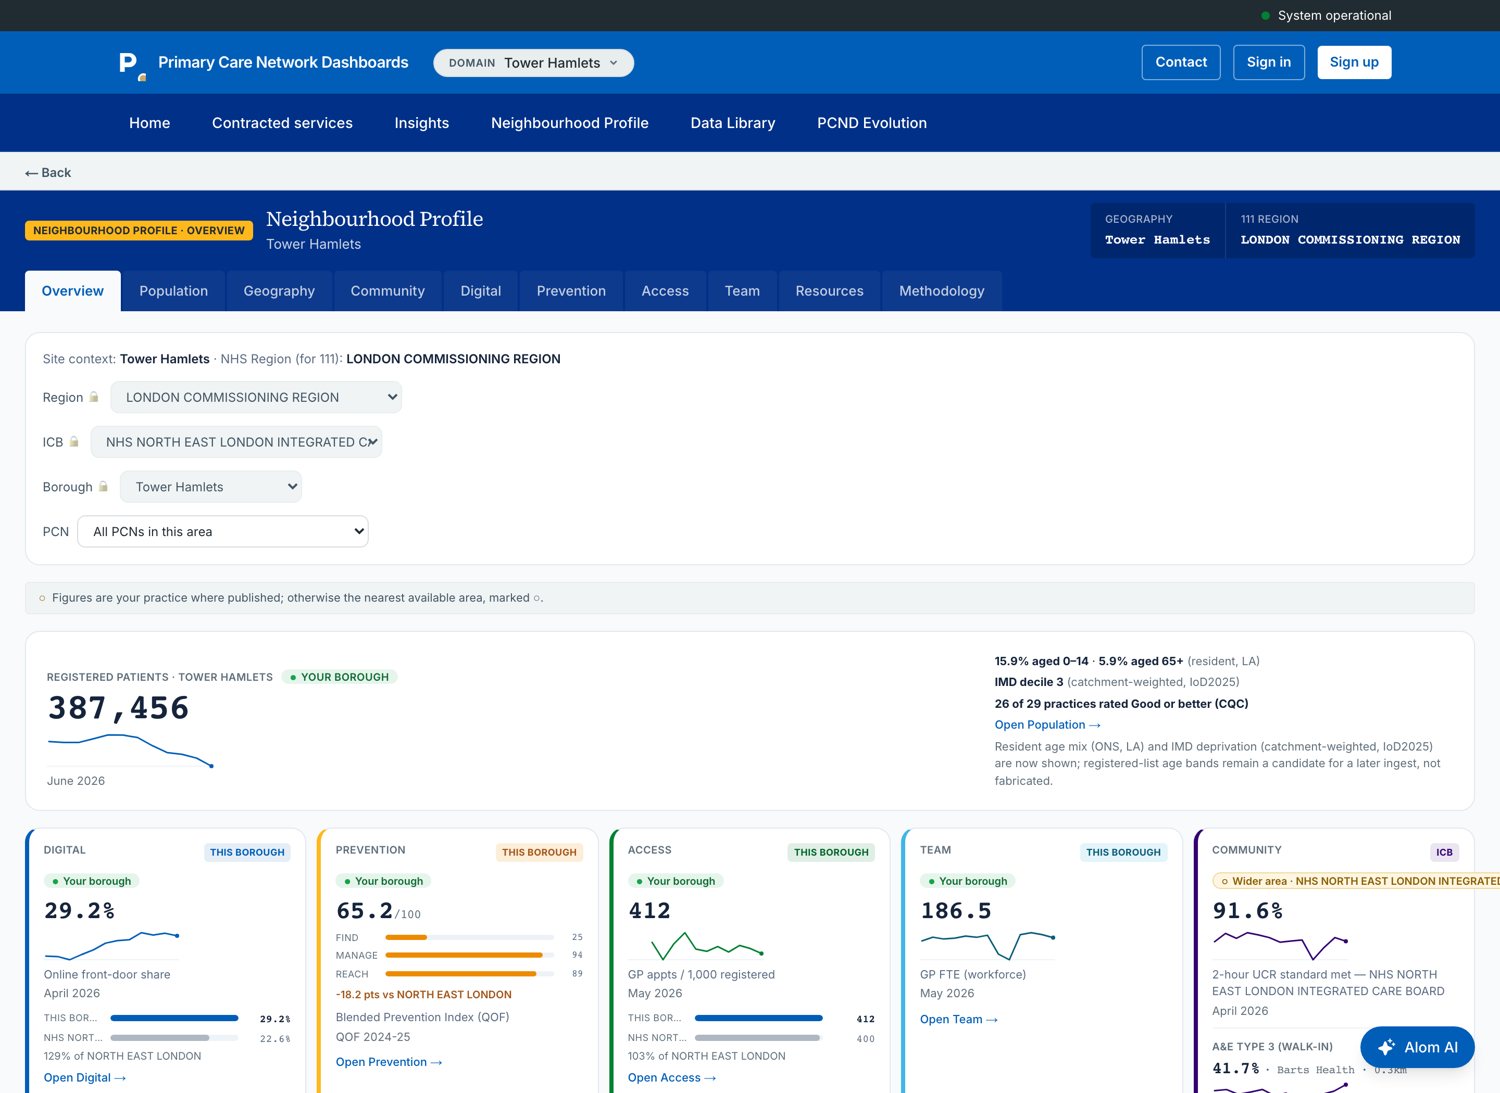
Today the dashboards live as a purpose-built platform at pcnd.info — engineered from the ground up rather than assembled from off-the-shelf parts. The defining change is in the data itself: catchment-weighting is handled as a materialised step in the pipeline rather than patched tile by tile, reconciling NHS-registered and LA-resident populations so every denominator matches the question being asked. Sixteen reporting domains — from ICCQ and QOF to childhood immunisations and sexual health — sit behind one open, login-free front door.
A decade on, the promise is exactly the one we made in 2015: your performance, online, anytime. Everything else — the tools, the scale, the ambition — is simply how far that one idea has travelled.
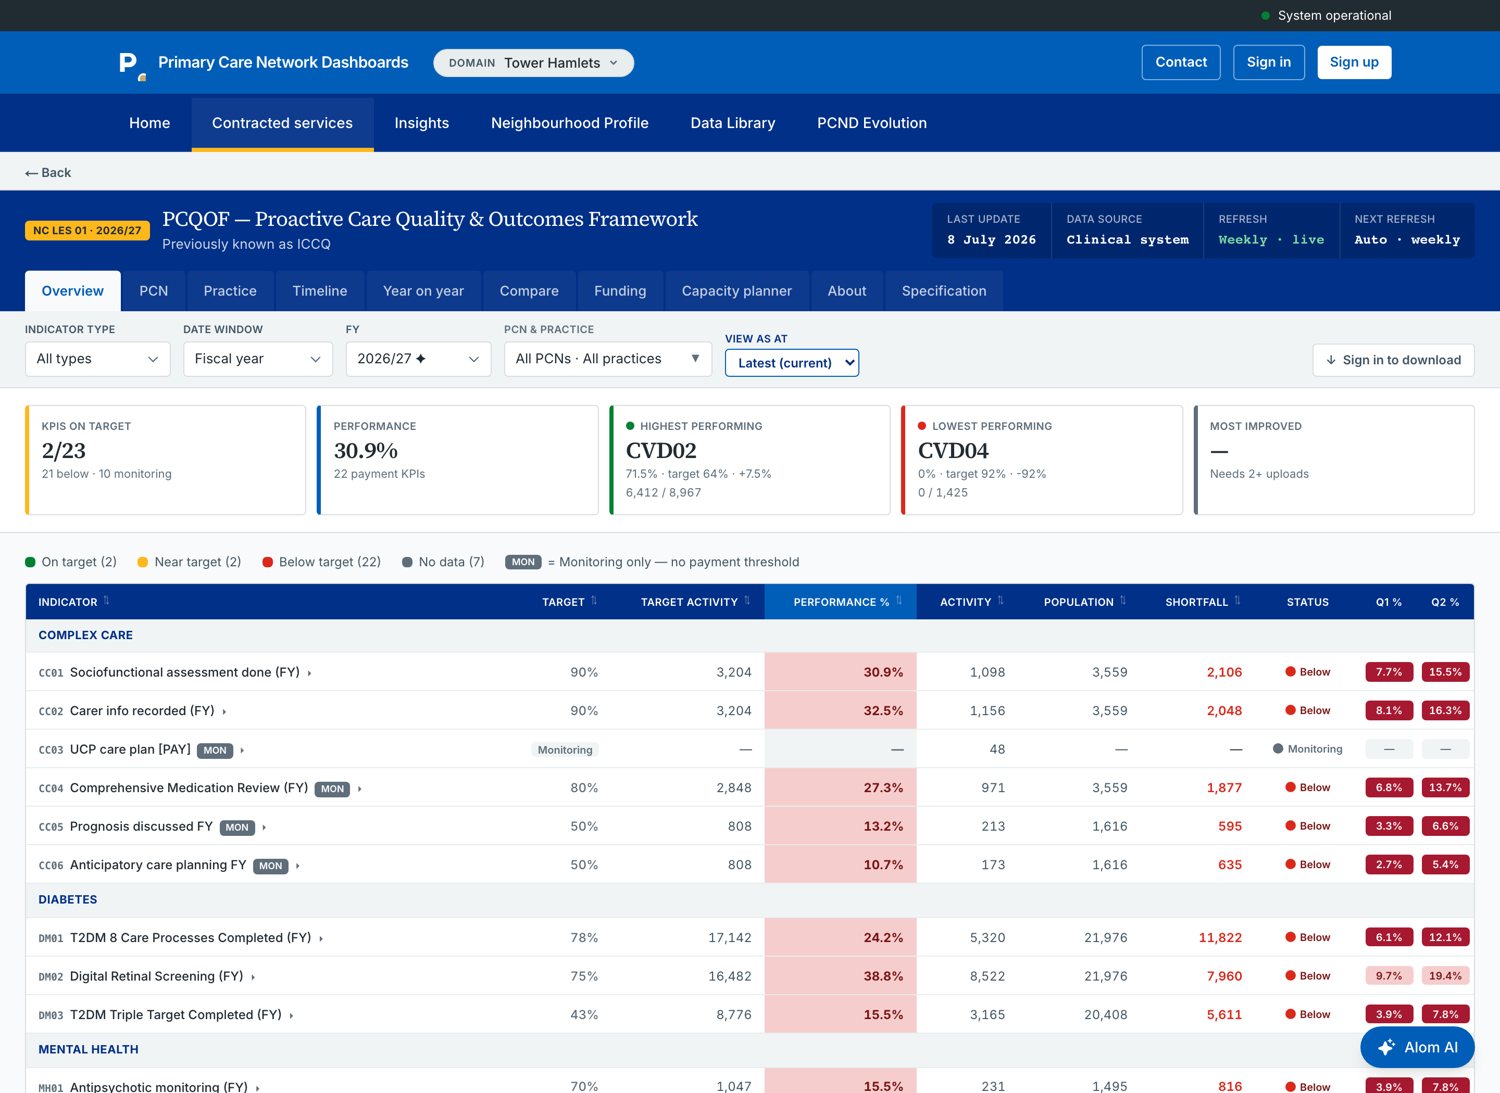
Under that one front door sits far more than a scoreboard. Contracted services — Local Enhanced Services, the Network Contract DES, QOF and the Investment & Impact Fund — are RAG-rated against live payment targets across multiple contract years, so a PCN can see at a glance where income is earned or at risk, practice by practice. Insights dashboards read across the wider system — access & demand, urgent & emergency care, medicines optimisation and workforce capacity. A Neighbourhood Profile sets that performance in the context of the population it serves, and an open Data Library brings deprivation, registered-list, GP-appointment, prescribing, A&E and CQC reference data into one place — no login, ever.
Underneath runs a fully automated ETL pipeline with catchment-weighted denominators reconciled at LSOA level, built-in calculators for DES and ARRS planning, and Alom AI — an assistant grounded in the platform’s own data. It now has a sibling, IPCN, carrying the same idea into practice HR and back-office admin. From an emailed spreadsheet to an integrated data platform, the promise never changed — only its reach did.
The bespoke platform today — pcnd.info.Contracted services, RAG-rated to payment targets.
The Neighbourhood Profile — performance in the context of the population it serves.